 |
 |
 |
 |
 |
 |
| Research leading to these results was funded by the European Union Framework Programme 7 (EU-FP7/2007-2013) Marie Curie postdoctoral fellowship PIEF-GA-2012-327226 (InSiDe-Strain, 2013-2015) | ||
In collaboration with
 |
 |
|
| Maurine MONTAGNAT | Thomas CHAUVE |  |
Why to perform EBSD on deformed/annealed ice?
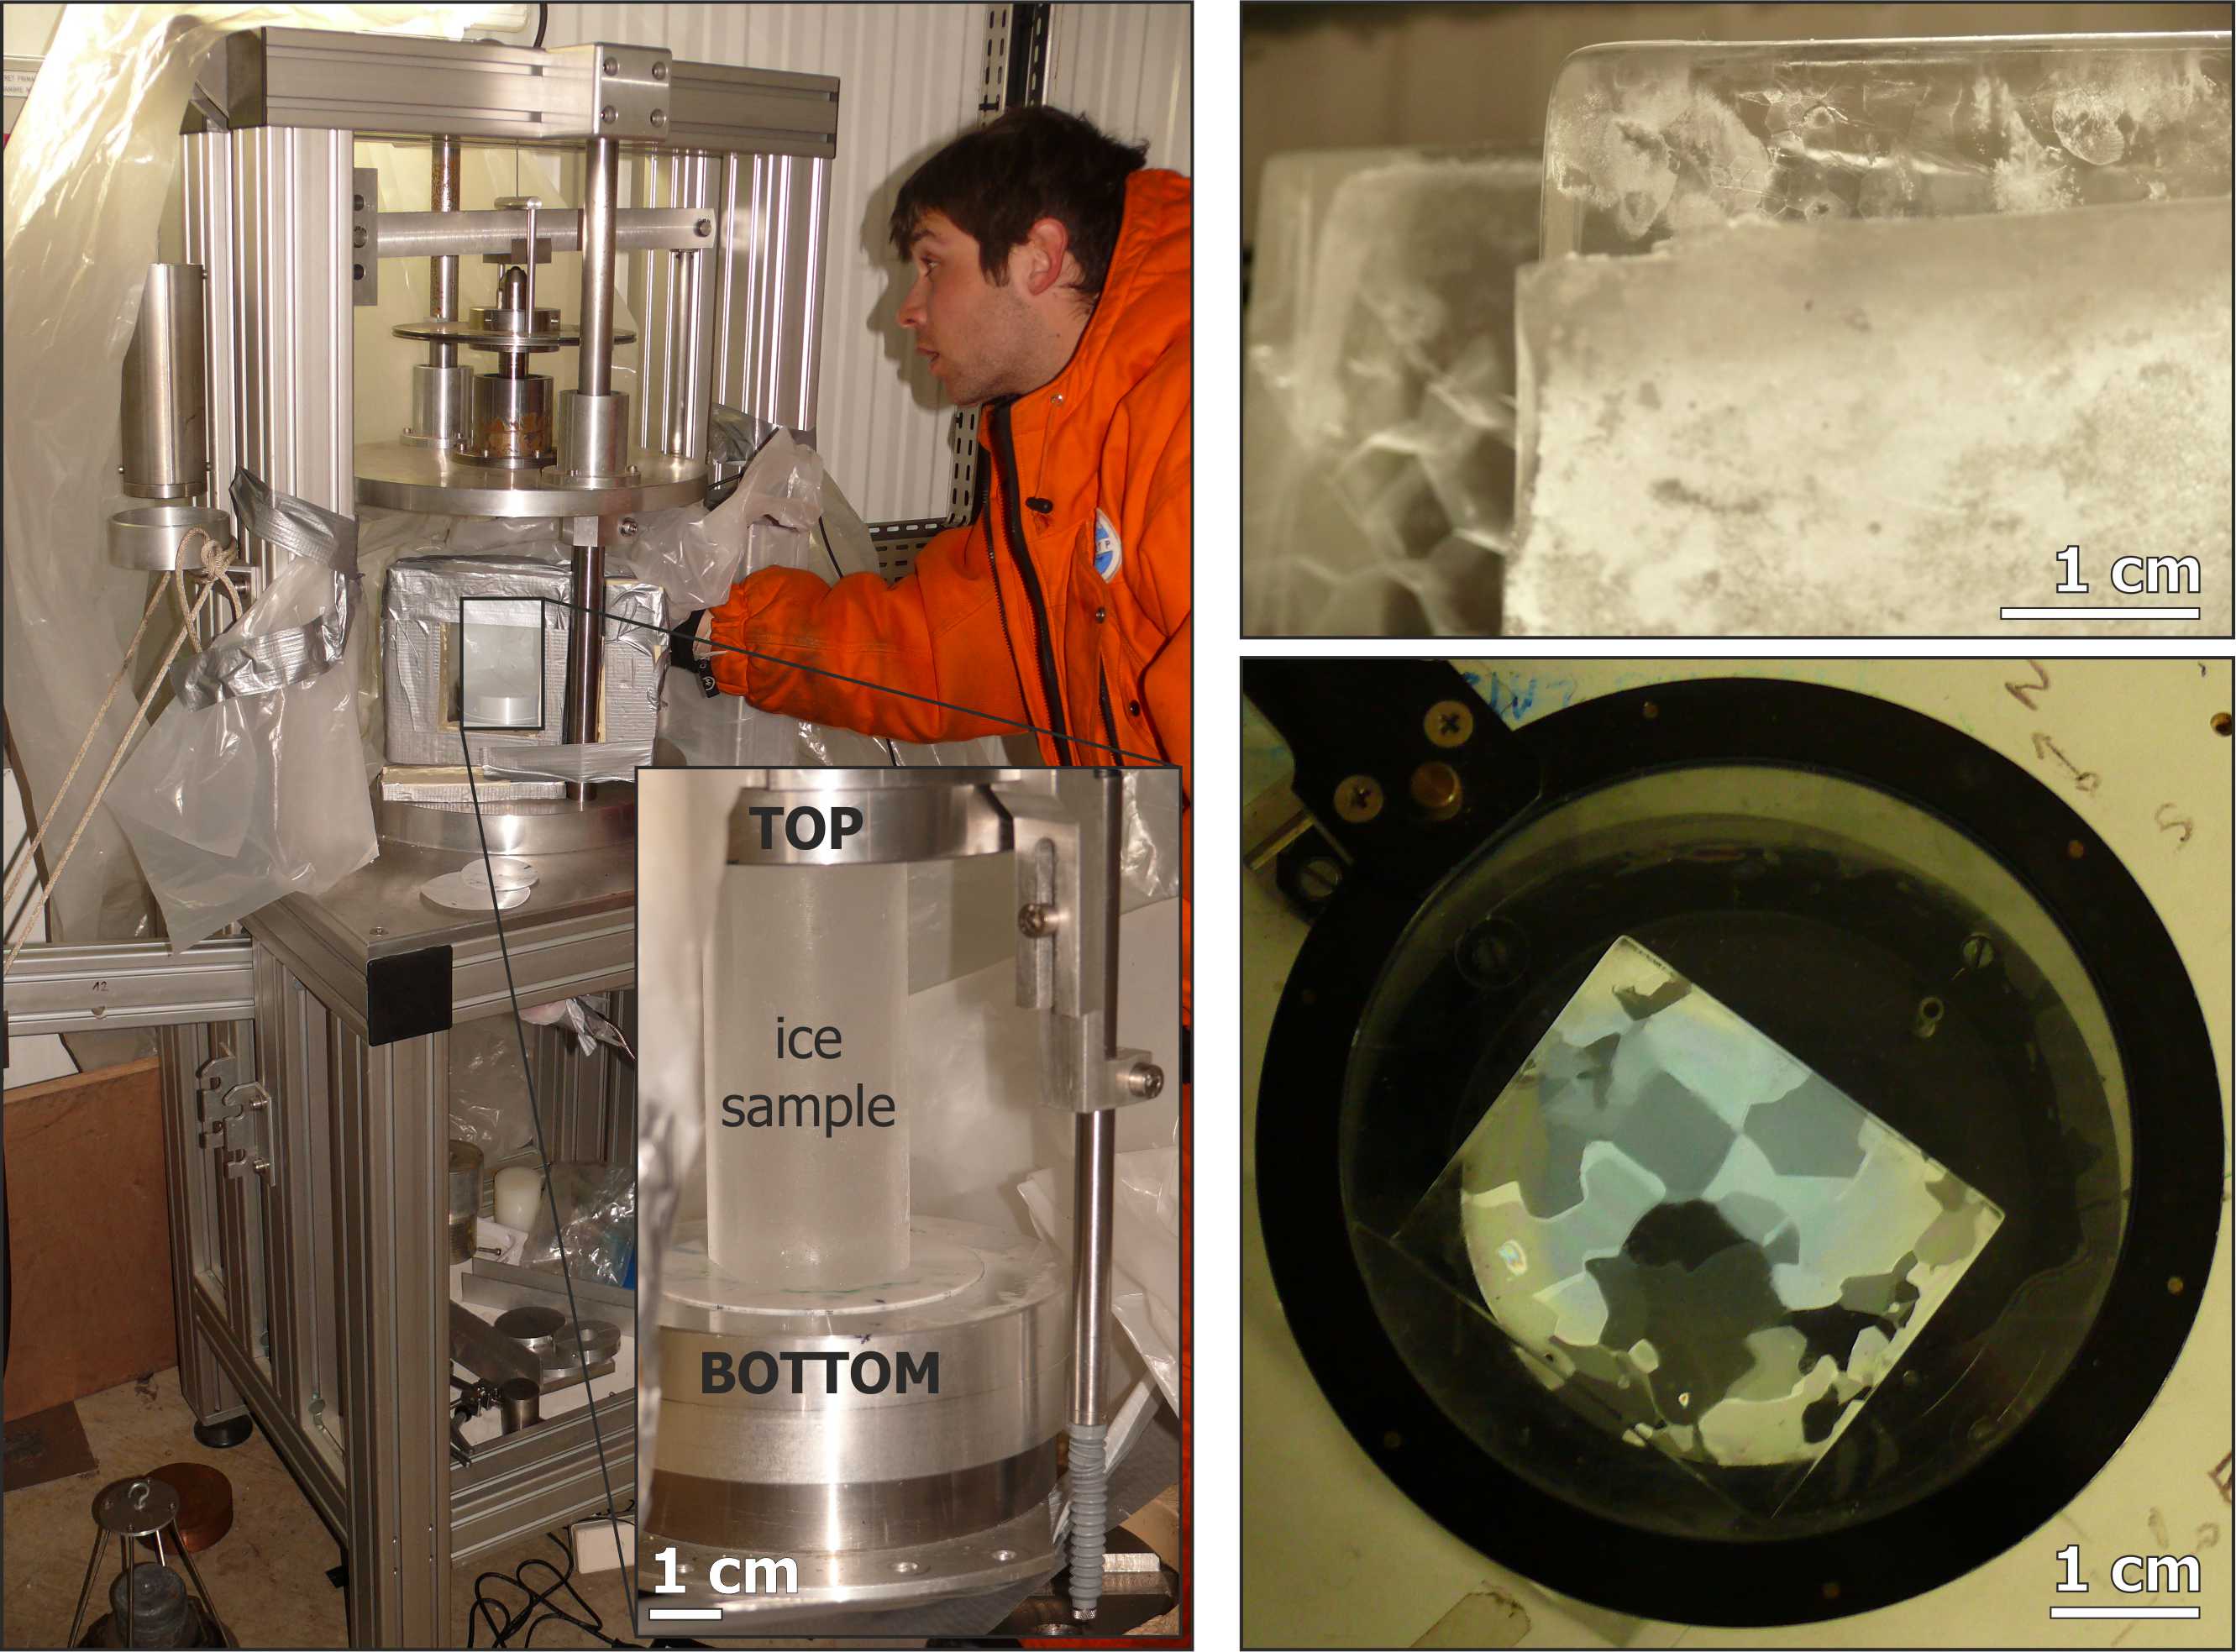
Deformation experiments at the LGGE-Grenoble (France)
 |
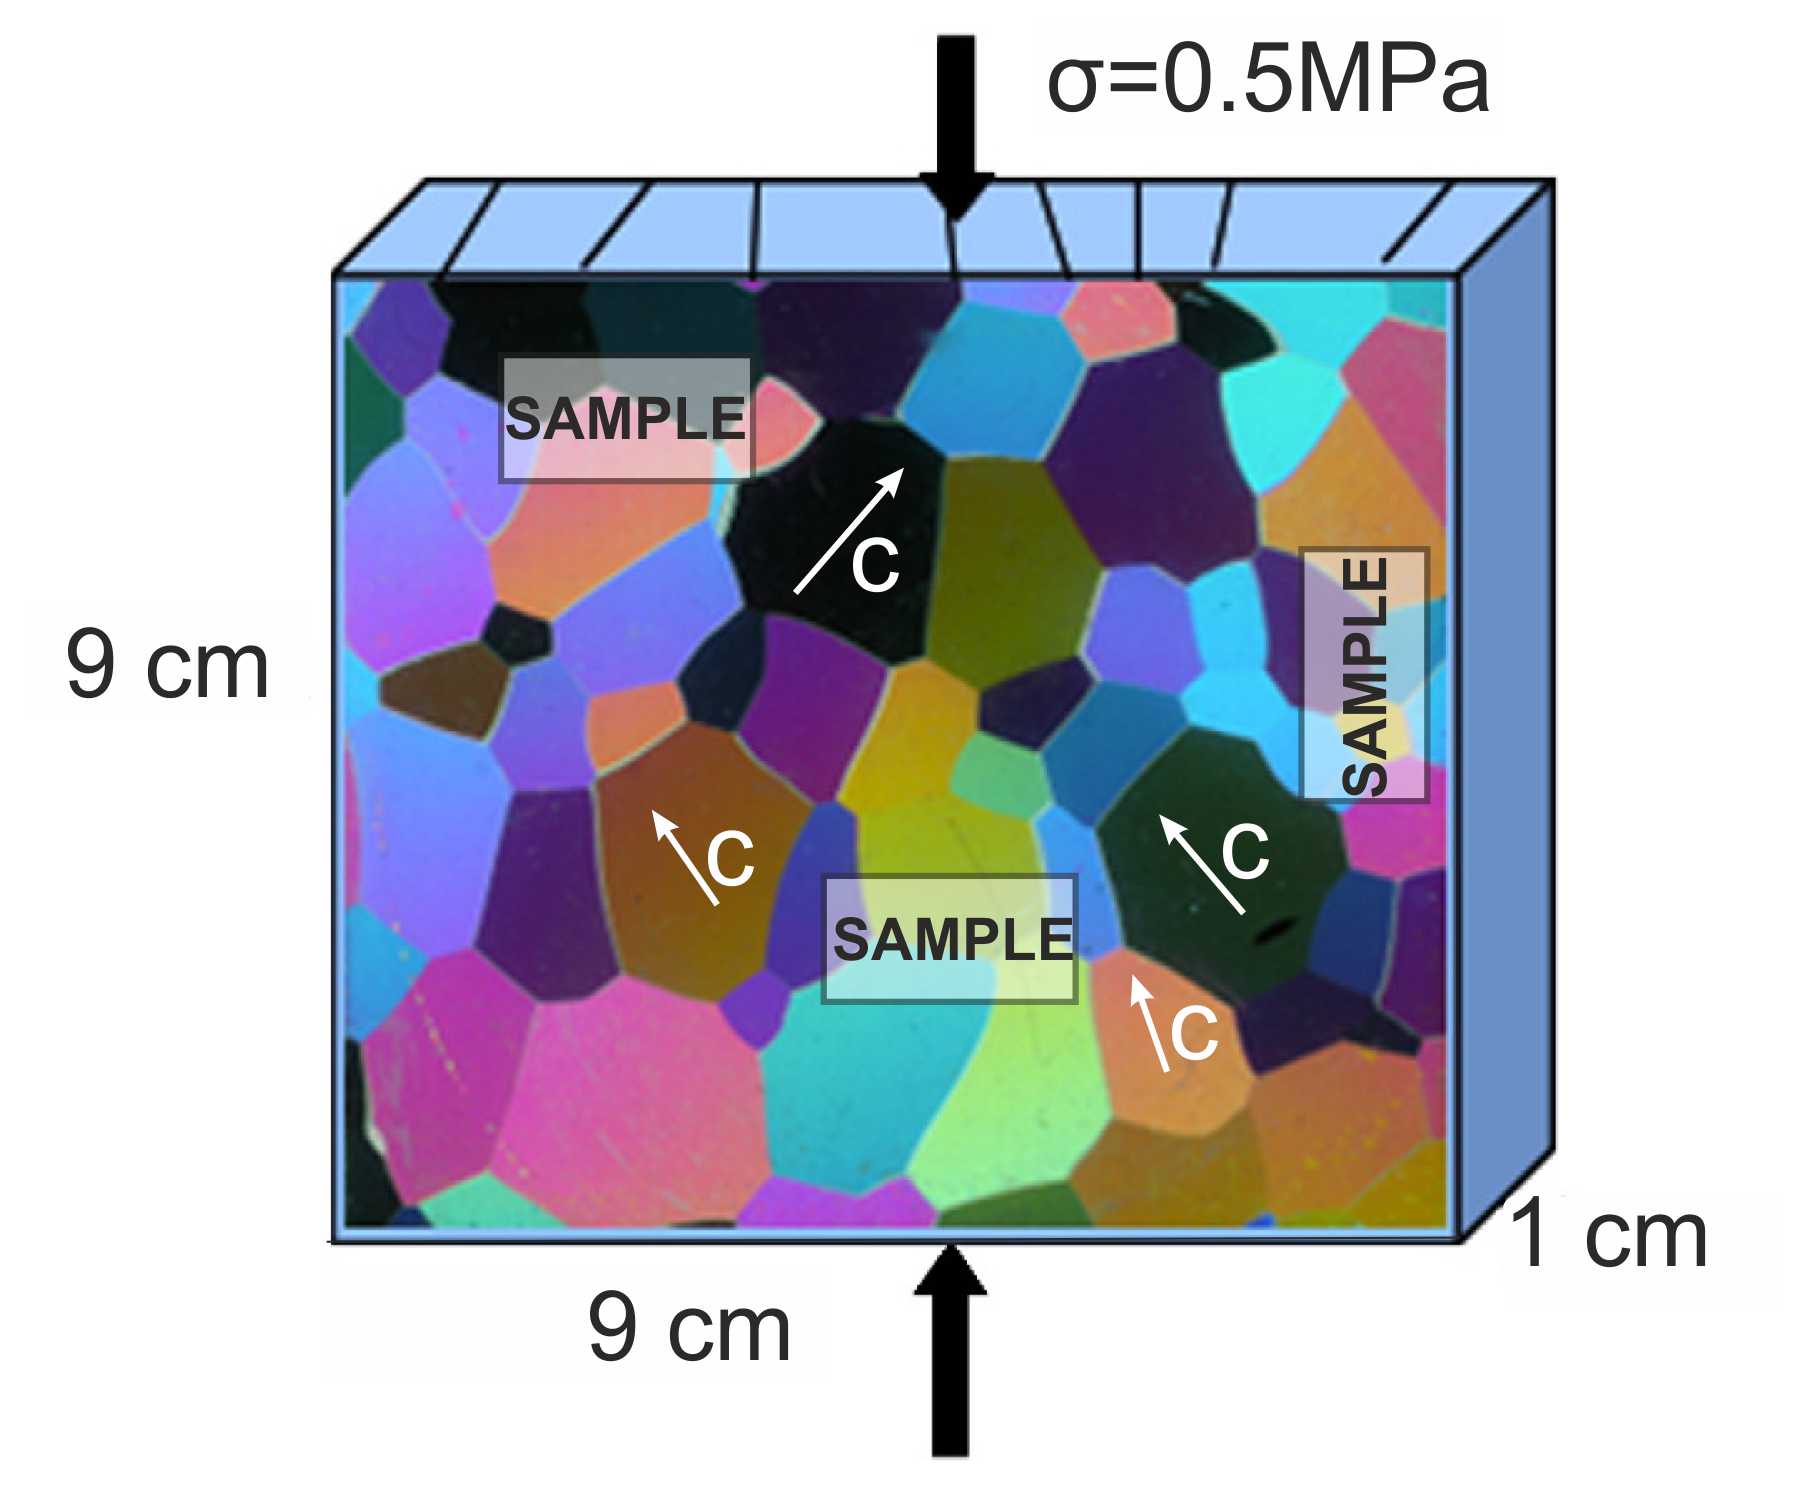 |
| Fig. 1 - Constant load uniaxial compression experiments (left) on laboratory-grown polycrystalline columnar ice (top and bottom in the center). Drawing on the right shows the experimental setup with respect to the crystallographic properties of the columnar ice polycrystals (image modified after Montagnat et al., 2011; EPSL). Rectangles labeled as "Sample" approximately correspond to the size of the sample holder in the cryogenic stage (Fig. 2). From the same deformation run product multiple samples are used for annealing. | |
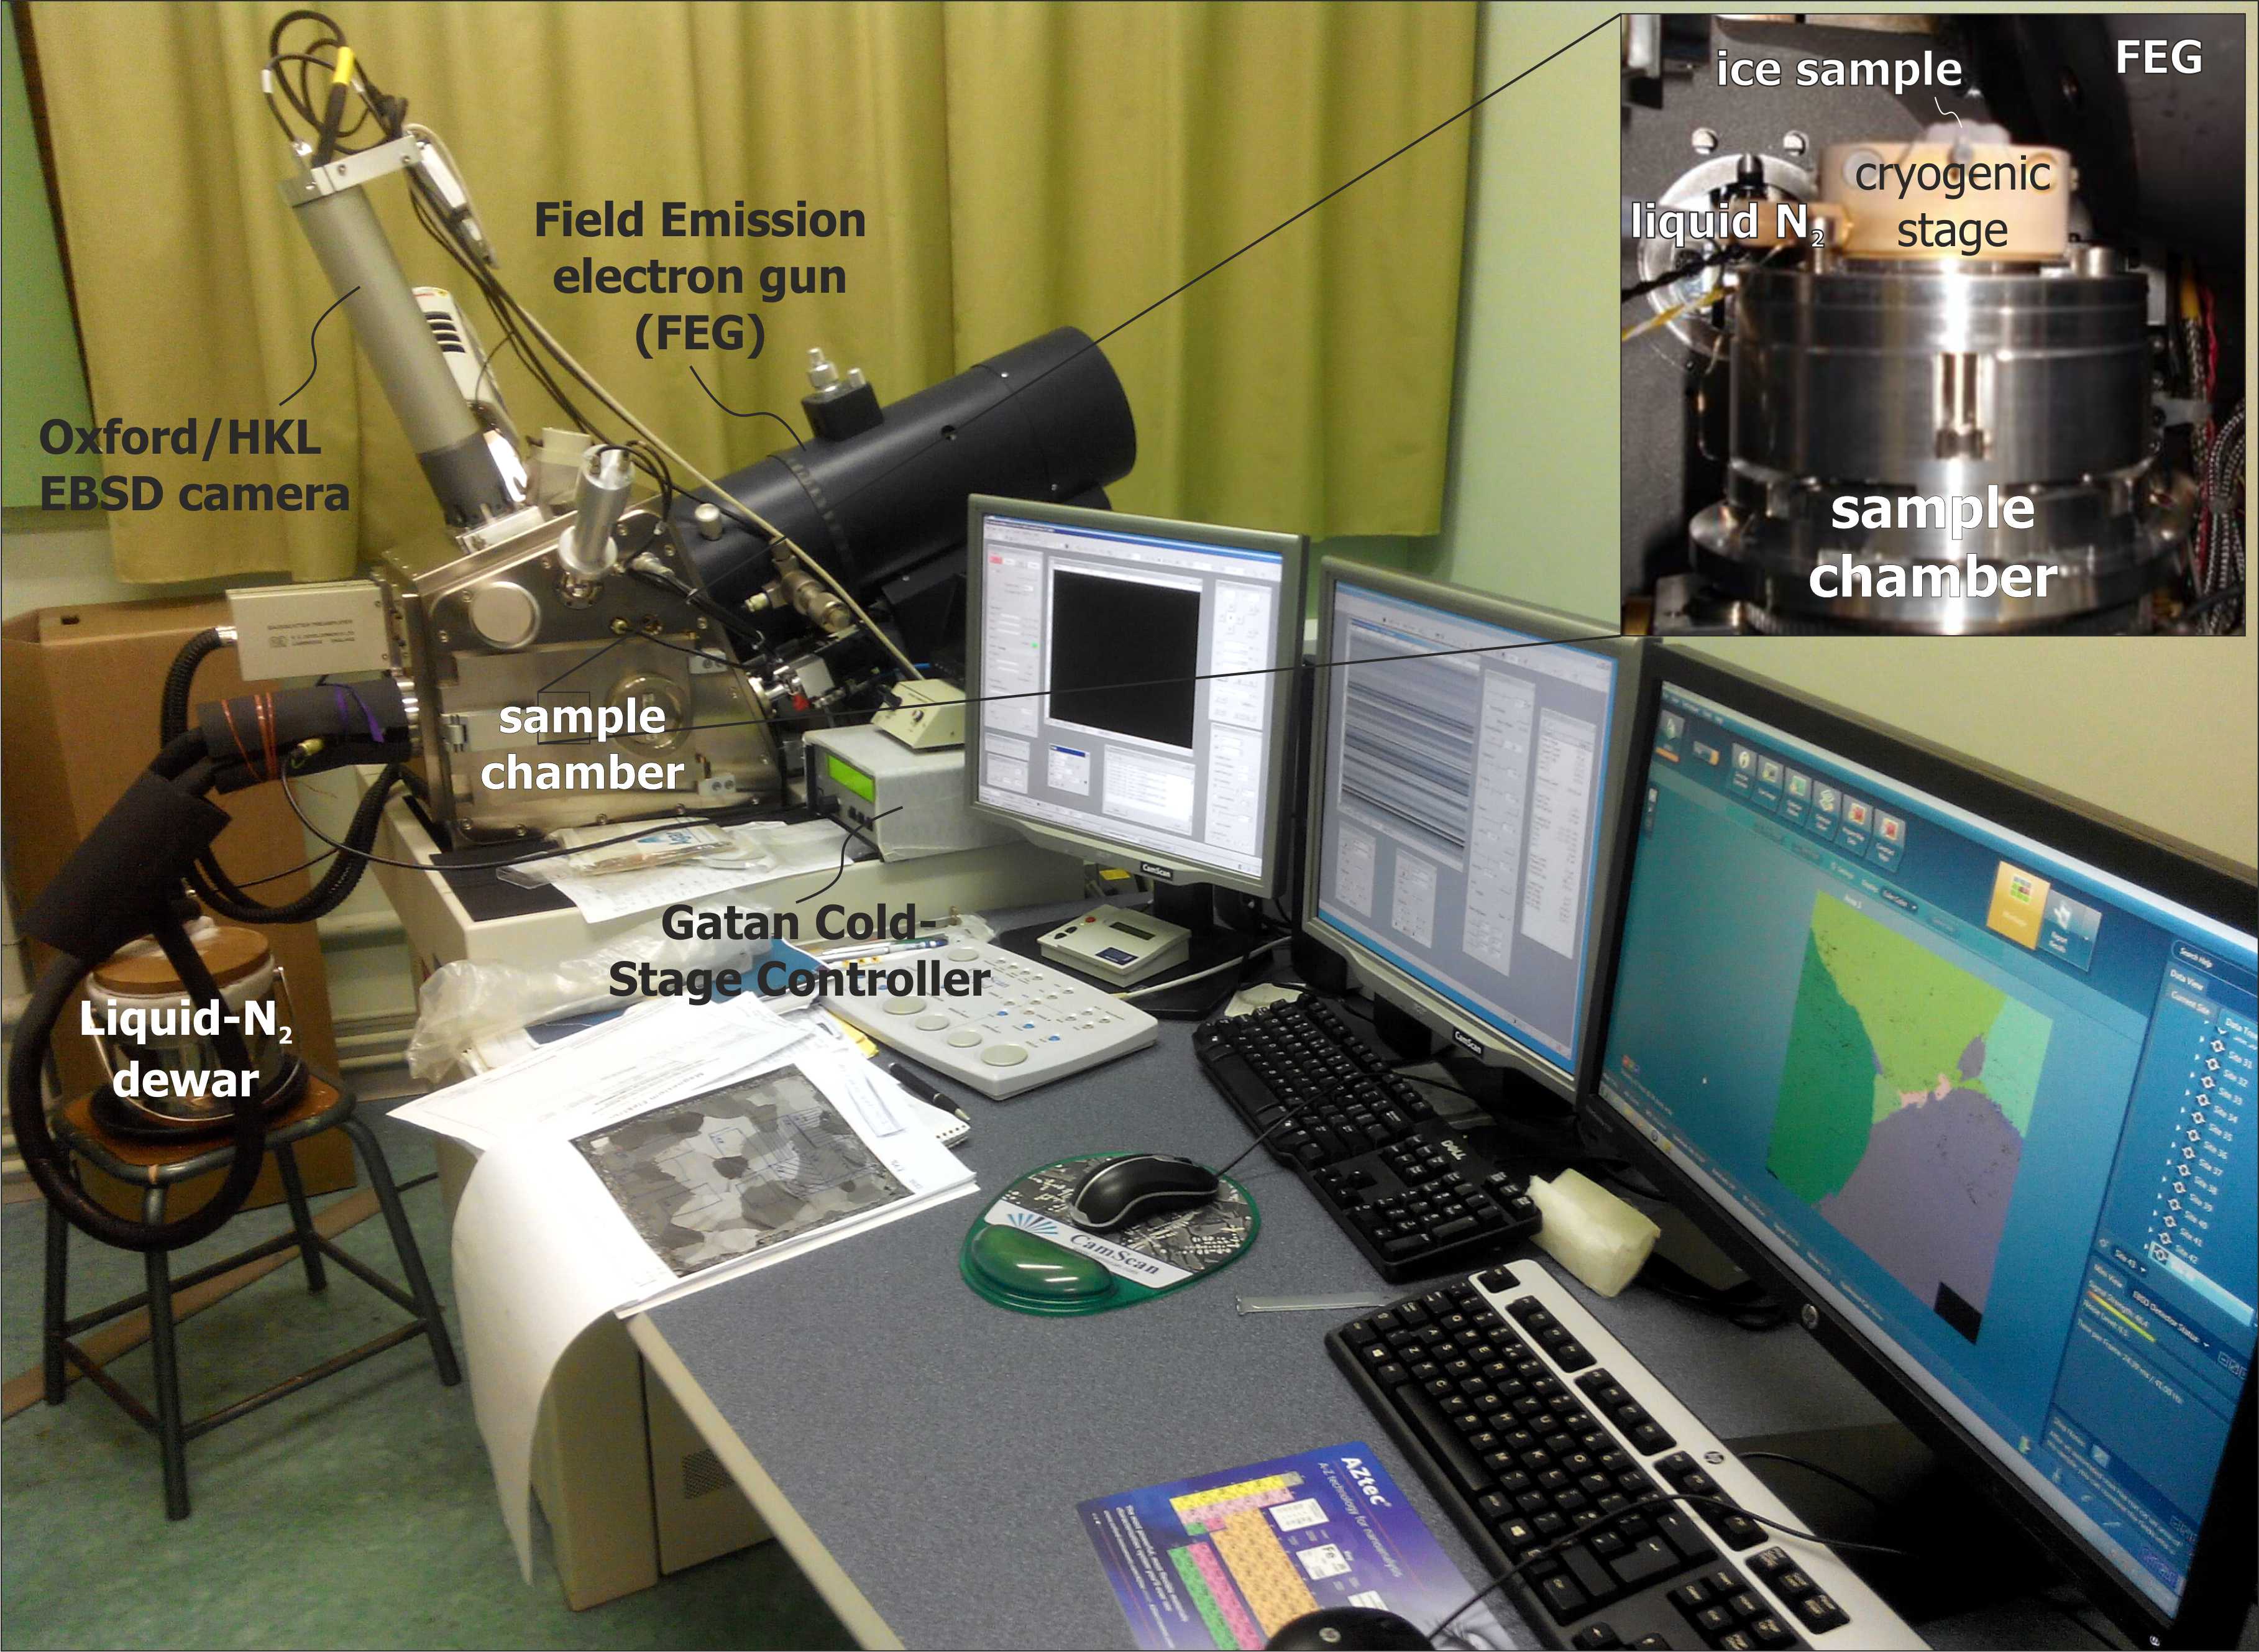
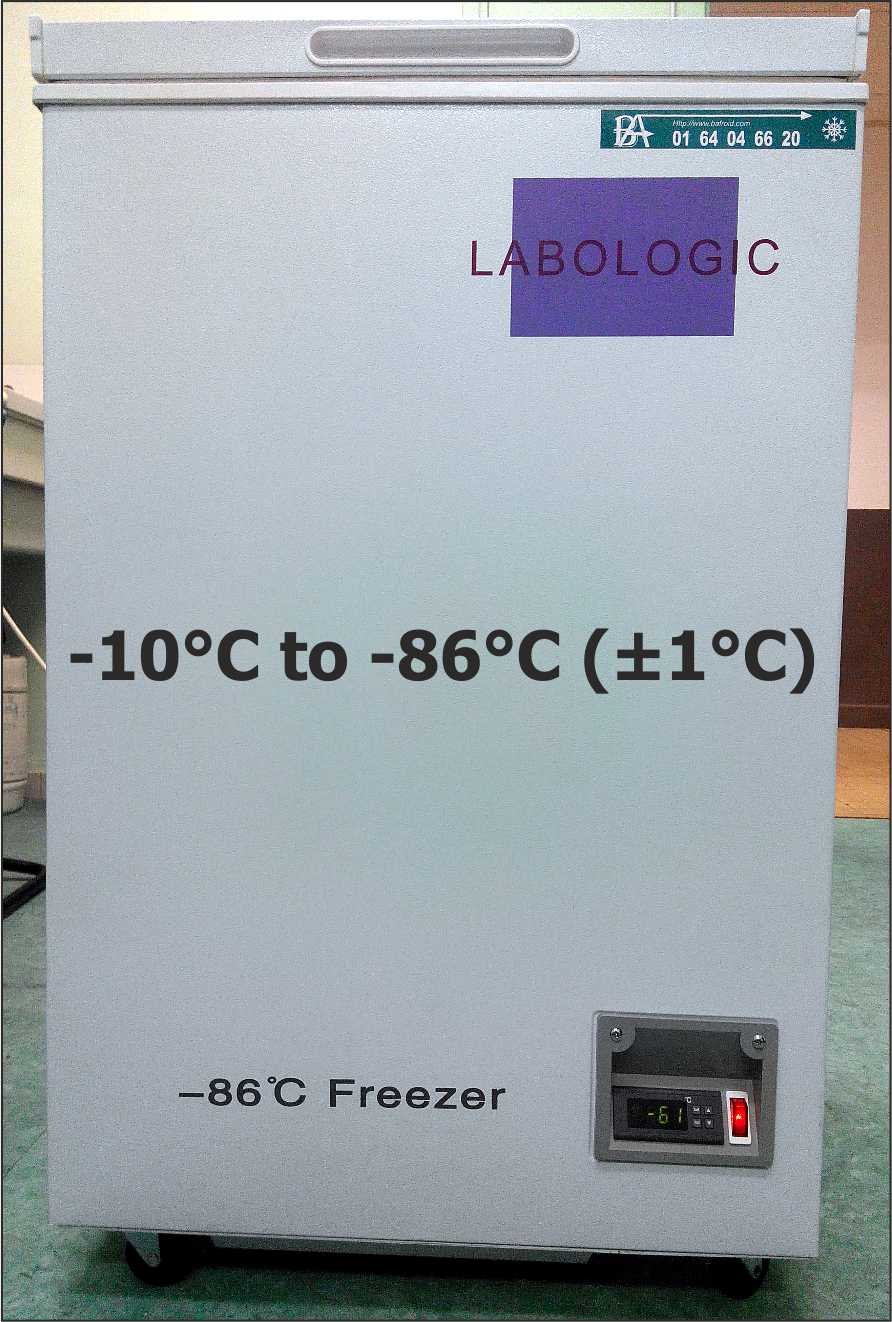
Annealing experiments at the Géosciences Montpellier (France)
 |
 |
 |
|
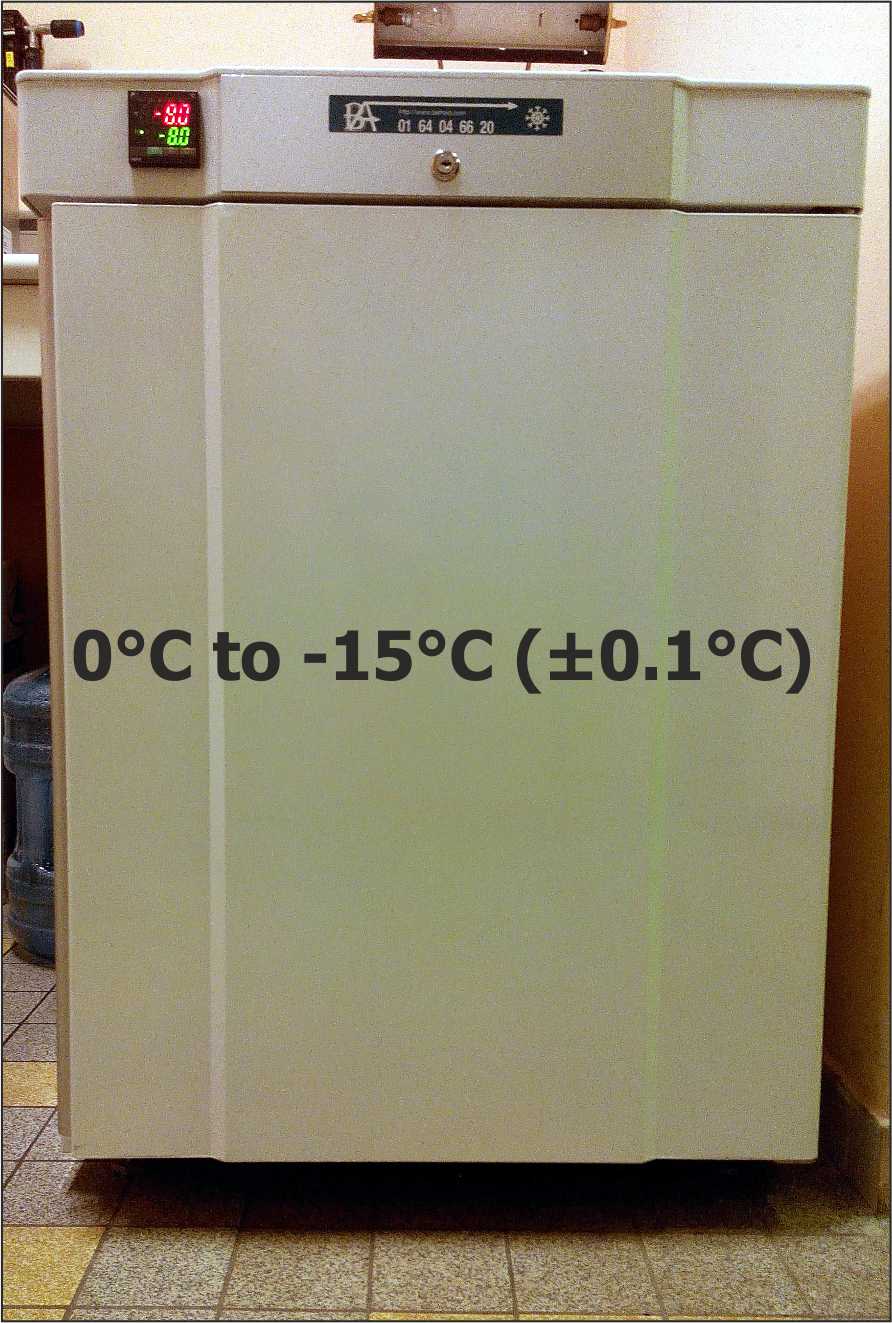
| Fig. 2 - CamScan X500-FEG CrystalProbe low-vacuum SEM-EBSD equipped with AZtec data acquisition software of Oxford Instruments for analysis (left), Labologic ultra-low temperature freezer for storage (top-right), and high-precision laboratory freezer for annealing of ice samples (bottom-right). The side of the horizontally lying cryogenic stage with an ice sample fixed on the plate is shown in the inset. | |
Challenges and drawbacks
 |
|
|
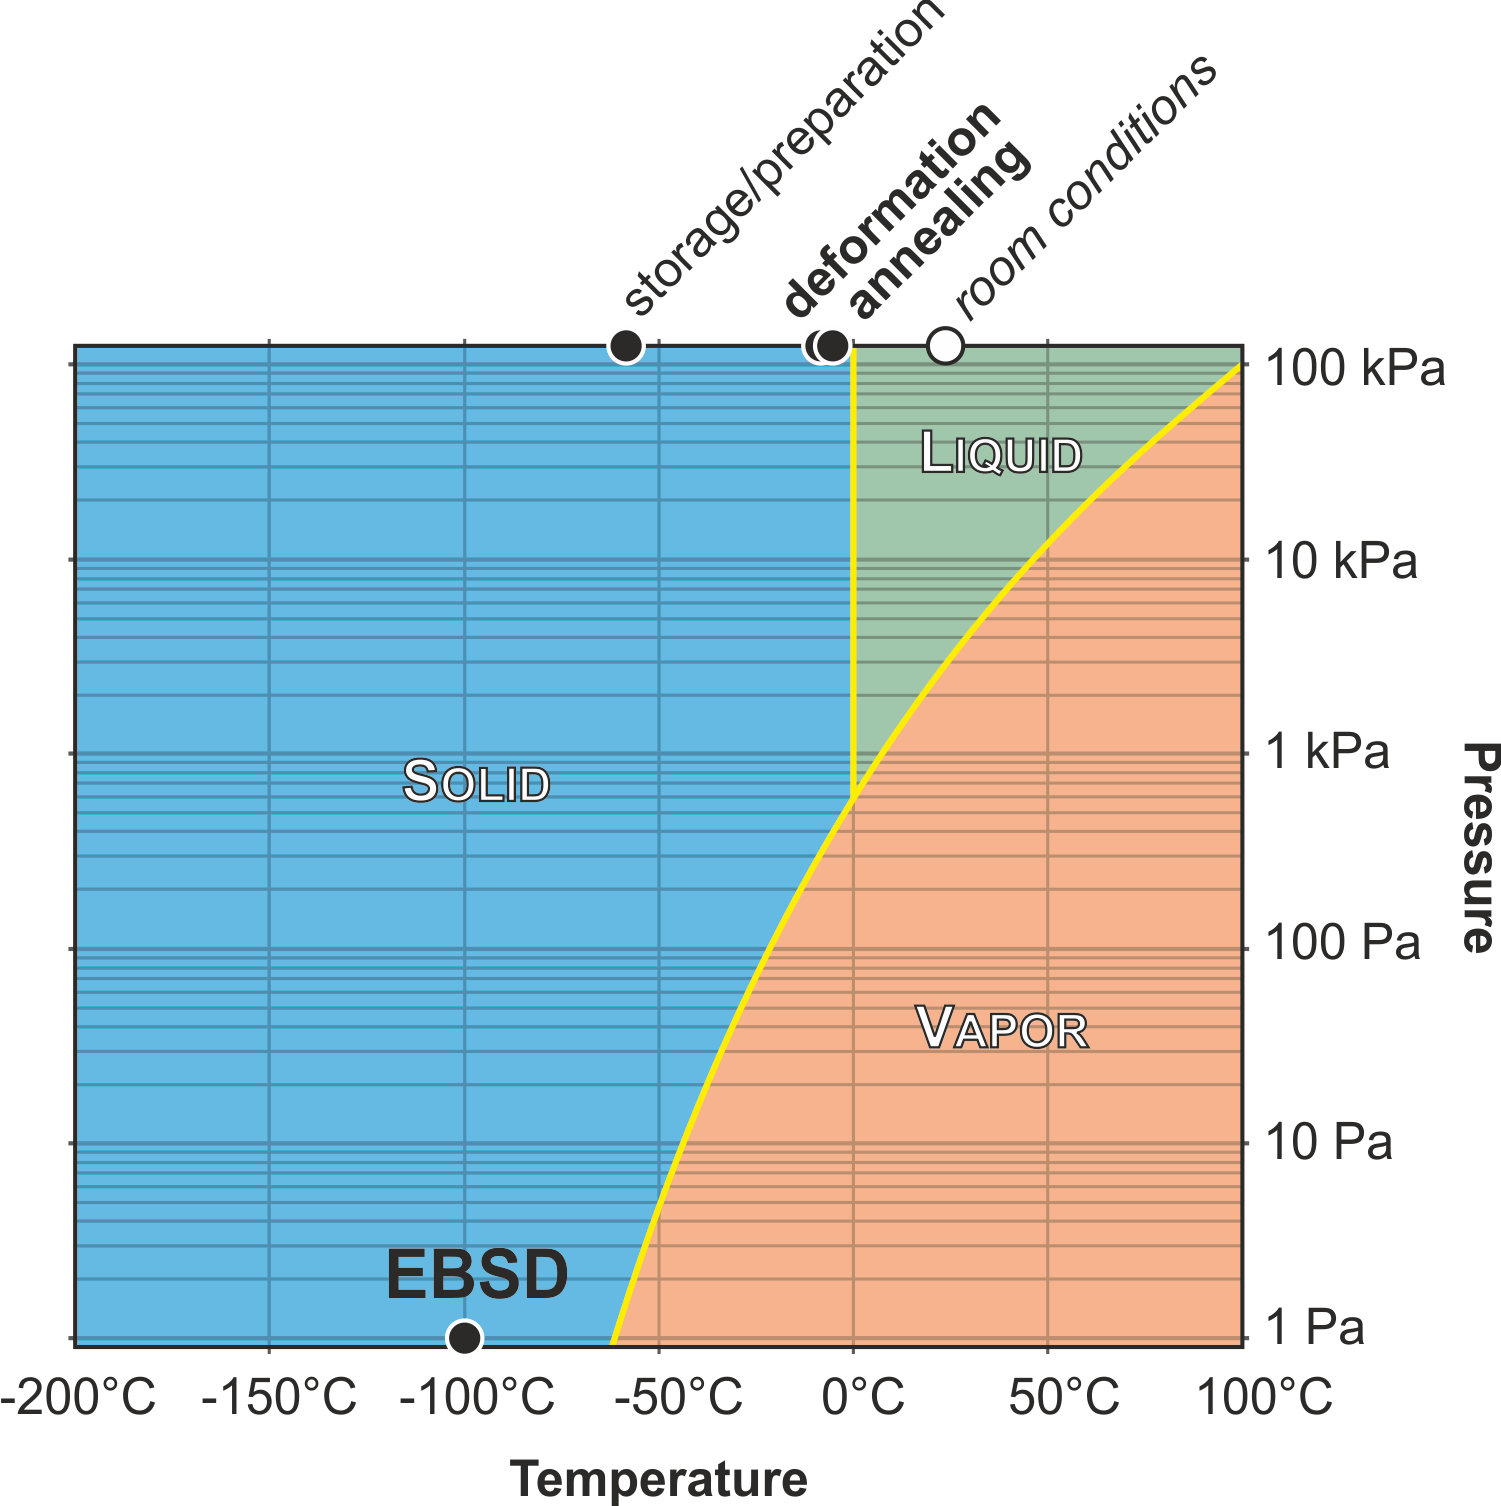
| Fig. 3 - Phase diagram of water as a log-lin chart with pressure from 1 Pa to 100 kPa and temperature from -200°C to +100°C (figure is adapted to work after the original compilation by Cmglee [CC BY-SA 3.0] via Wikimedia Commons). Black dots show P-T conditions of deformation, annealing, long-term storage and cryogenic EBSD analysis of ice samples. White dot indicates room conditions. | ||
 |
 |
|
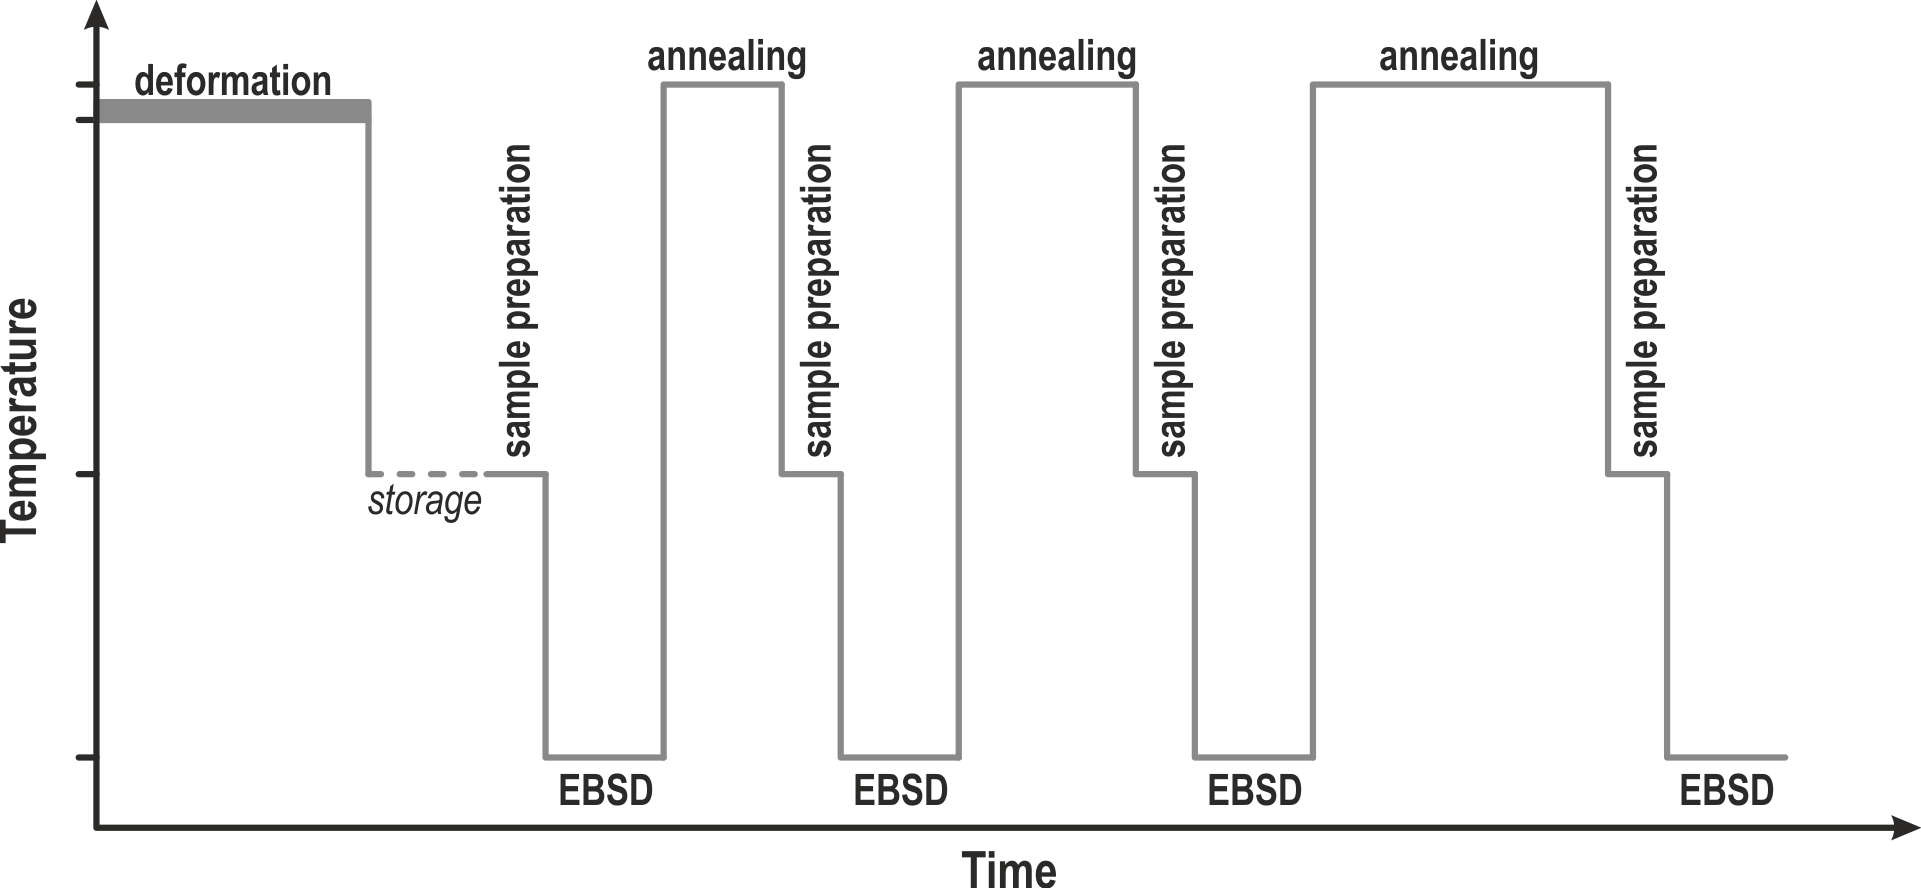
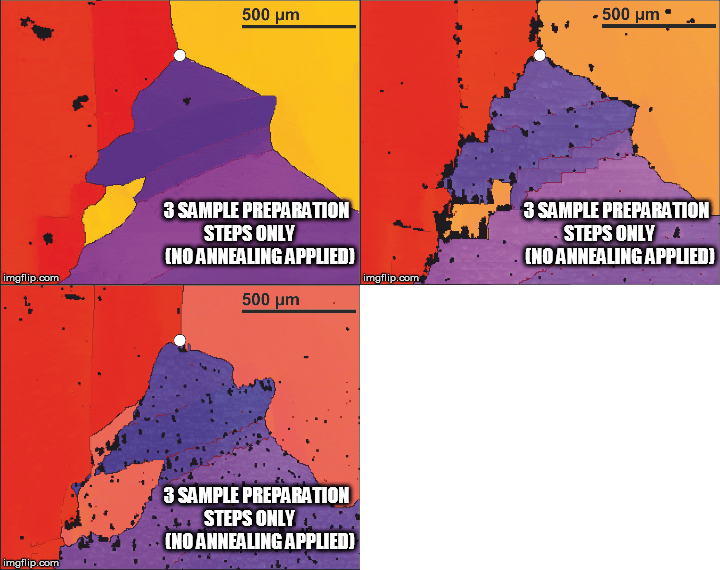
| Fig. 4 - Experimental protocol for the annealing experiments of ice. | Fig. 5 - Effect of sample preparation (no annealing applied). Note the apparent growth of the grain in the bottom left corner. Coloring corresponds to grain orientation, black spots are non-indexed defects of the sample surface. White dot denotes approximately the same position within the sample. |
Results
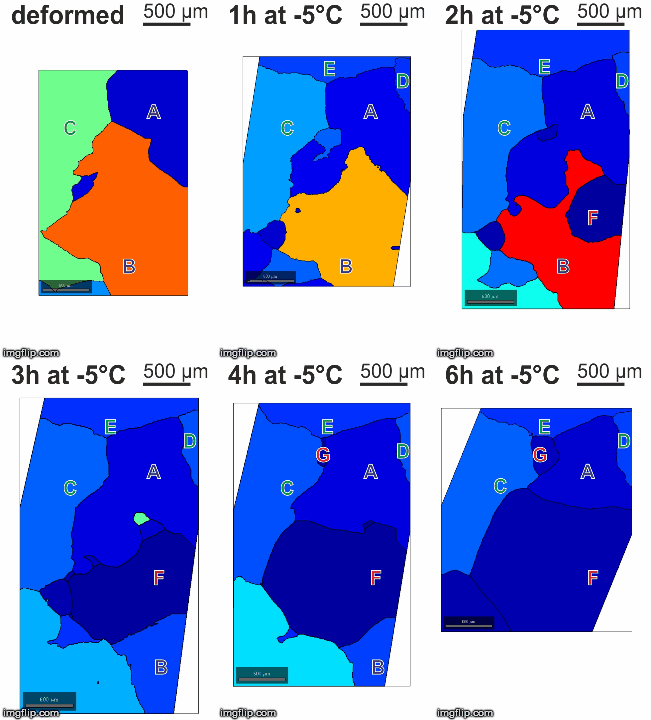 |
Fig. 6 - Microstructural evolution from the deformed state to 6 hours of annealing at -5°C. Color coding indicates variation of orientation within a grain (intragranular misorientation), where hotter the color, larger the variation. Capital letters label the same grain throughout the experiment. Note how grain B, which had the largest initial misorientation shrinks and is being consumed by the growing grain F that has the lowest intragranular variation of orientation. Grain boundaries of grains C, D & E are quite stable and do not change significantly, but they become more straight in the course of the experiment. |
Implications
In the course of post-dynamic annealing experiments:
- overall internal misorientation of all grains decreases (=image is getting blue);
- grain boundary migration is restricted at stable grains that initially had low internal misorientaions;
- grain growth proceeds only at domains with high intraganular misorientations.
Publications and meeting abstracts
Chauve, T., Montagnat, M., Barou, F., Hidas, K., Tommasi, A., Vacher, P. (2015) Strain field evolution during creep on ice: impact of dynamic recrystallization mechanisms. European Geosciences Union General Assembly 2015, 12-17 April, 2015, Vienna, Austria, Geophysical Research Abstracts 16, EGU2015-4871
Chauve, T., Montagnat, M., Barou, F., Hidas, K., Tommasi, A., Vacher, P. (2015) Strain field evolution during creep on ice: impact of dynamic recrystallization mechanisms. 13th International Conference on Creep and Fracture of Engineering Materials and Structures (CREEP 2015), 31 May-4 June, 2015, Toulouse, France, Abstract Volume
Chauve, T., Montagnat, M., Barou, F., Hidas, K., Tommasi, A., Mainprice, D., Piazolo, S., Wheeler, J. (2015) Nucleation processes occurring during dynamic recrystallization in ice. AGU Fall Meeting 2015, 14-18 December, 2015, San Francisco, USA
Chauve, T., Montagnat, M., Barou, F., Hidas, K., Tommasi, A., Mainprice, D. (2017) Investigation of nucleation processes during dynamic recrystallization of ice using cryo-EBSD. Philosophical Transactions of the Royal Society A: Mathematical, Physical and Engineering Sciences 375: 2086.
Hidas, K., Tommasi, A., Mainprice, D., Chauve, T., Barou, F., Montagnat, M. (2015) Strain analysis by EBSD during annealing of ice Ih. Micro-Dynamics of Ice (Micro-DICE) ESF Research Networking Programme 2015, 30 March-1 April, 2015, Montpellier, France, Abstract Volume
Hidas, K., Chauve, T., Tommasi, A., Barou, F., Montagnat, M., Mainprice, D. (2015) Sites of high stored energy and grain boundary migration during post-dynamic and static recrystallization of ice Ih. 13th International Conference on Creep and Fracture of Engineering Materials and Structures (CREEP 2015), 31 May-4 June, 2015, Toulouse, France, Abstract Volume
Hidas, K., Tommasi, A., Mainprice, D., Chauve, T., Barou, F., Montagnat, M. (2017) Microstructural analysis of the thermal annealing of ice-Ih using EBSD. European Geosciences Union General Assembly 2017, 23-28 April, 2017, Vienna, Austria, Geophysical Research Abstracts 19, EGU2017-8470
Hidas, K., Tommasi, A., Mainprice, D., Chauve, T., Barou, F., Montagnat, M. (2017) Microstructural evolution during thermal annealing of ice-Ih. Journal of Structural Geology 99, 31-44.
Mainprice, D., Hidas, K., Tommasi, A., Chauve, T., Barou, F., Montagnat, M. (2015) Microstructural of analysis by EBSD during deformation and annealing of ice Ih. AGU Fall Meeting 2015, 14-18 December, 2015, San Francisco, USA
Paper cut-out model of ice with hexagonal crystal symmetry
Do you want to display the hexagonal crystal symmetry in 3D? Build your own ice crystal! Click here to download the annotated paper model then cut out, fold and glue. 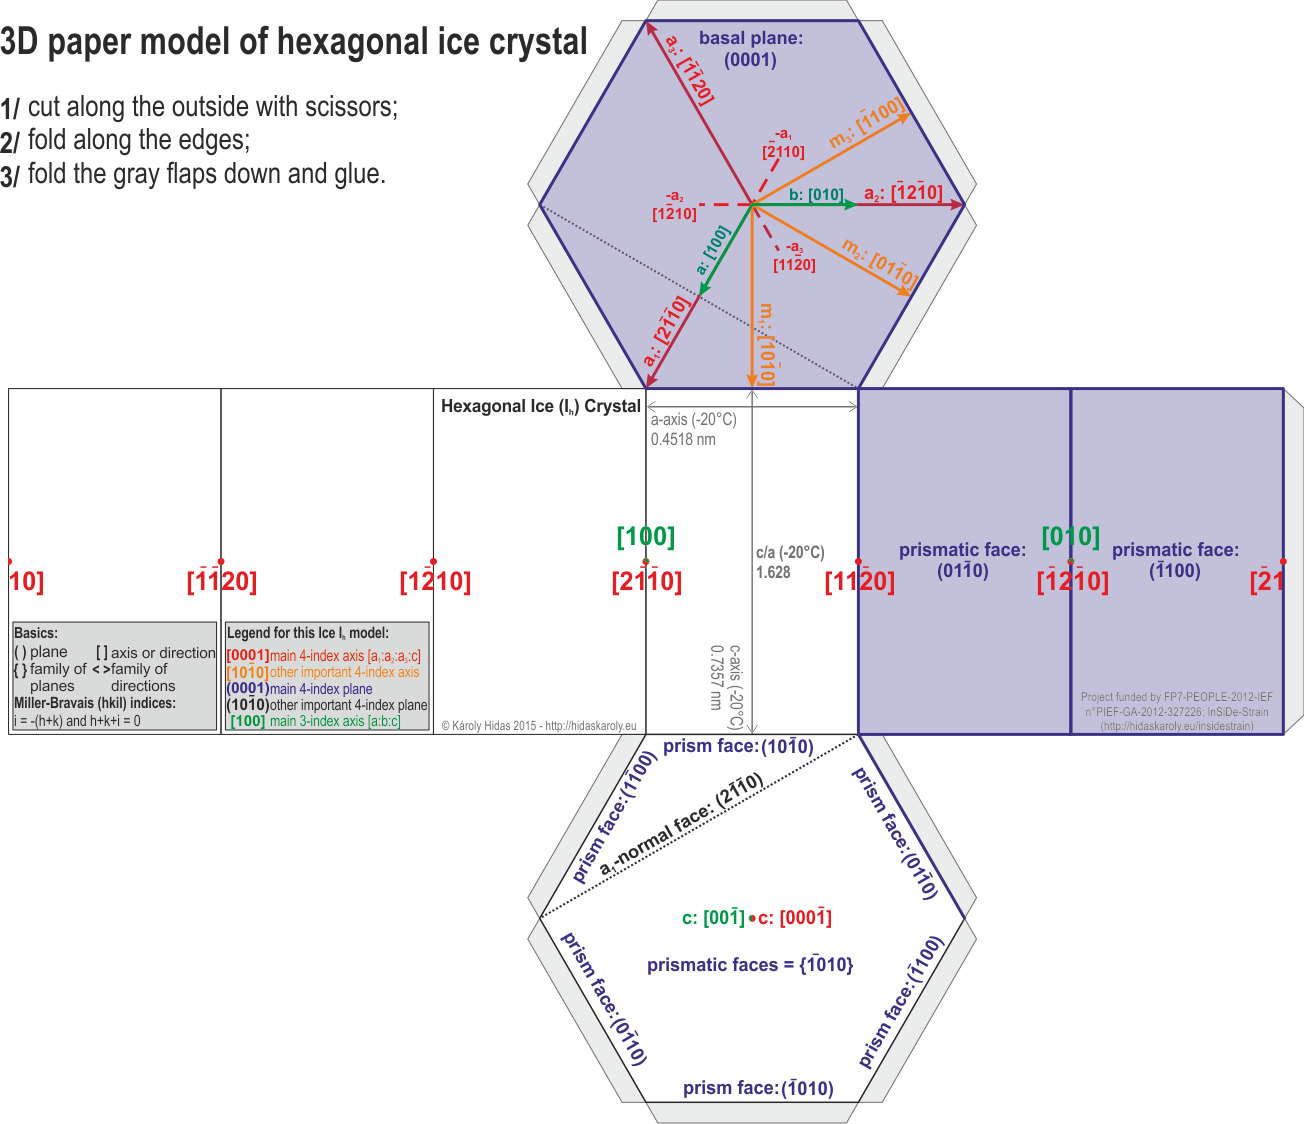 |
 |
 |
 |